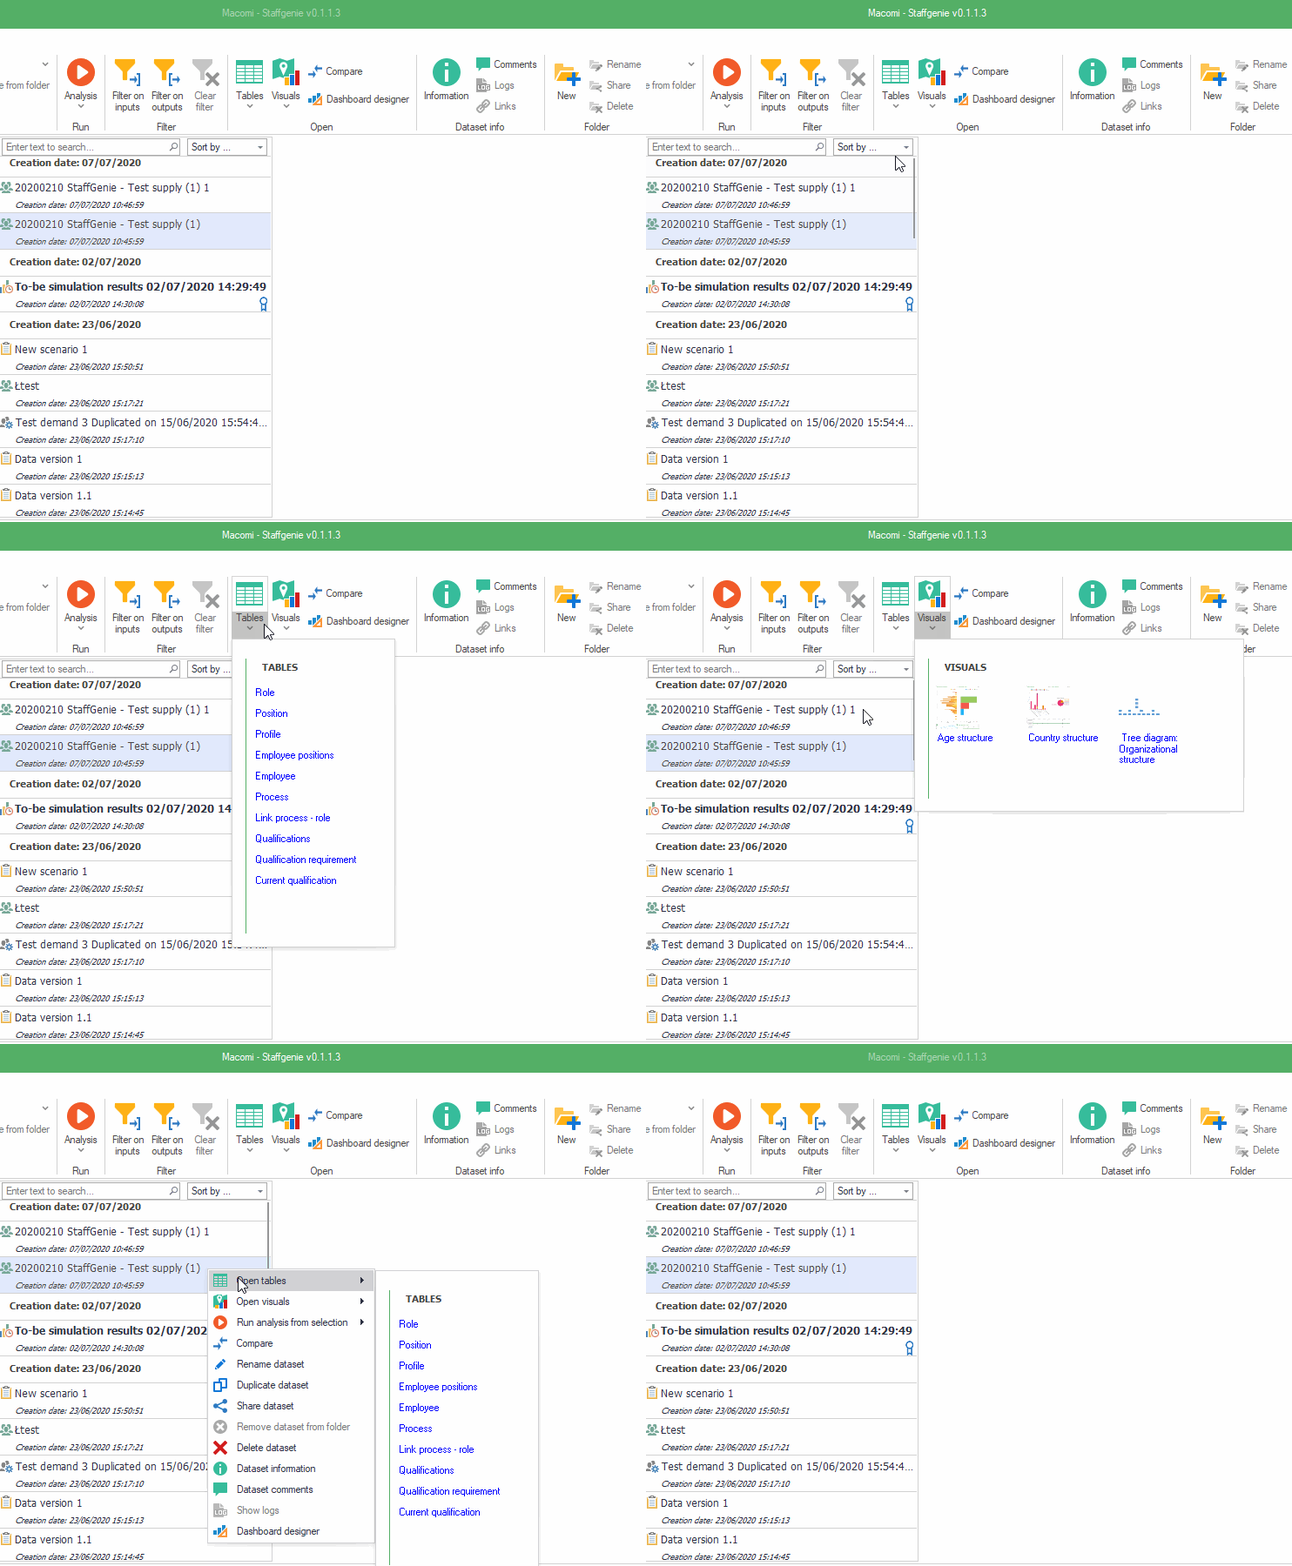
To view the data inside a dataset, you can use menus in the ribbon or in the context menu. The options to open a dataset depend on the project and the dataset type. Typically, it is possible to view data in tables, as pivots, as charts, and using special views such as a Gantt-chart or an animation.
In the ribbon, in the group ‘Open’, you can find two buttons:
- Tables. Click this button to see all tables and pivots available for the selected dataset.
- Visuals. This button will show you all charts, dashboards and other types of visual views if available, like animation and map.
The same menus are available in the context menu. To see them, right-click on a dataset.

Comparing two datasets
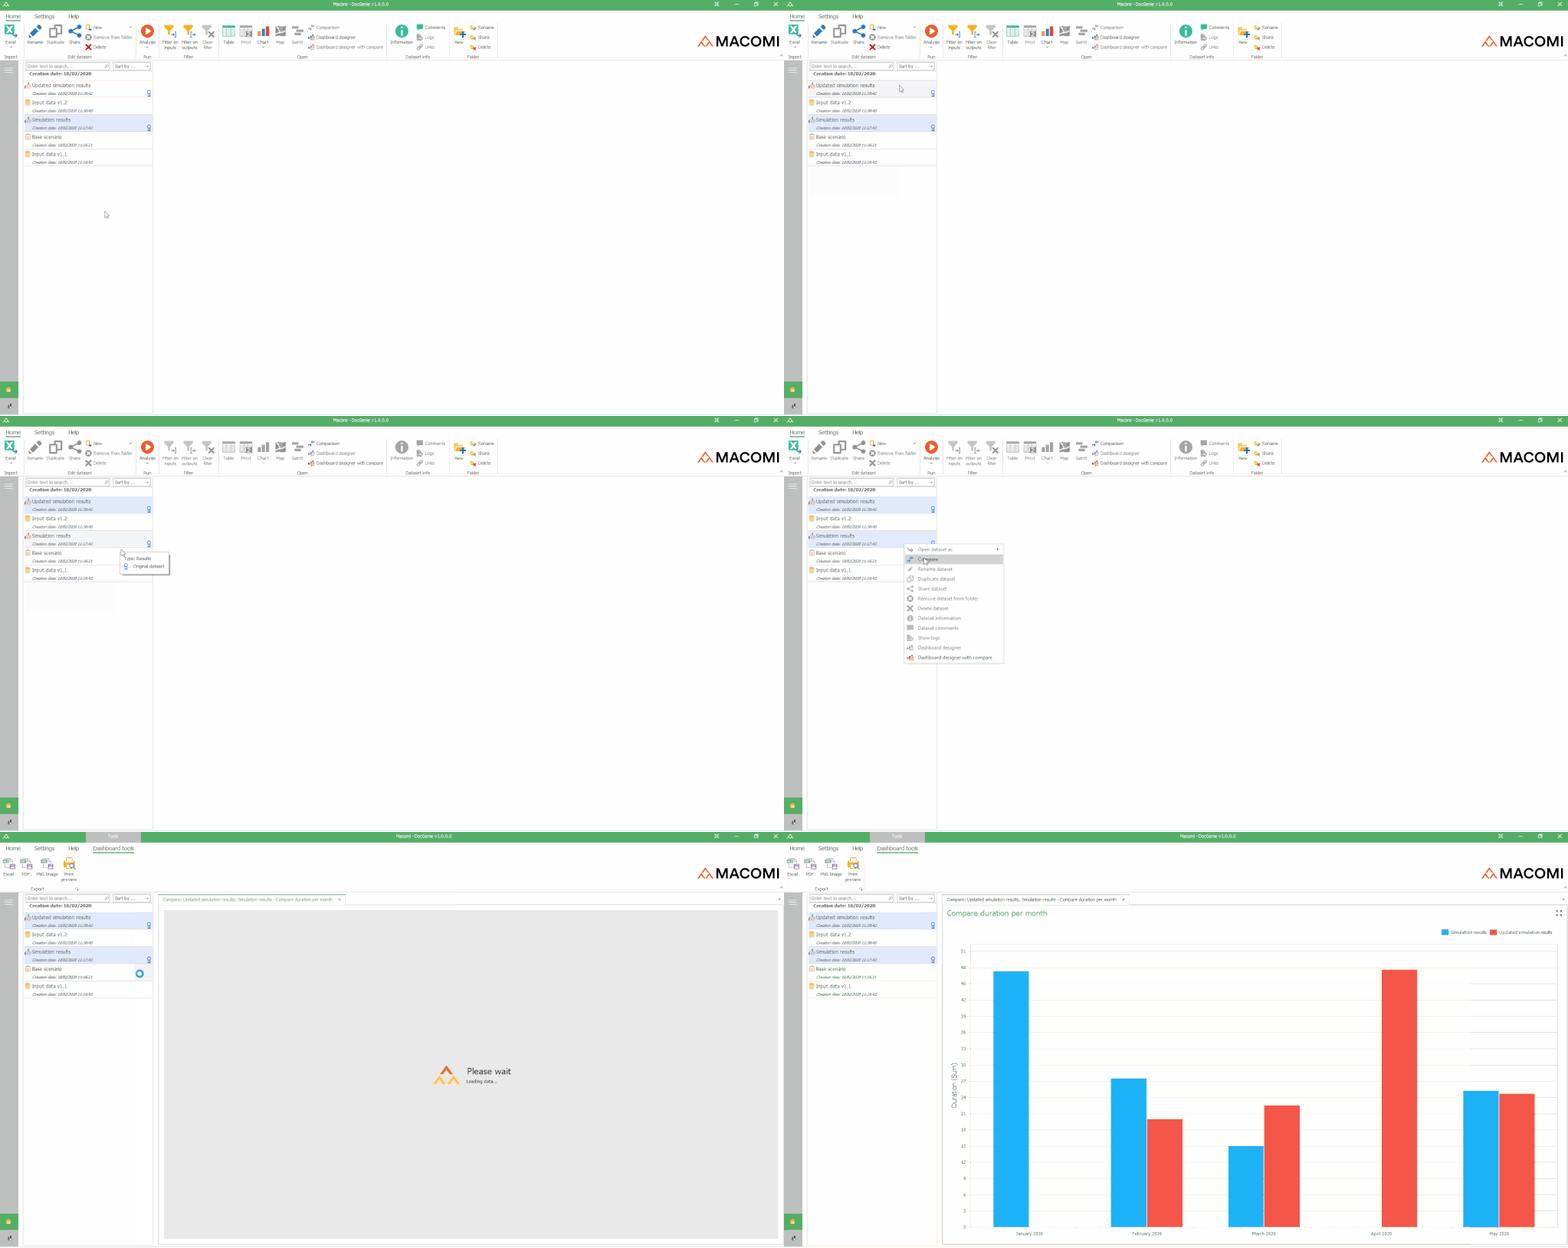
For certain types of datasets, it is possible to use an open behaviour which compares two or more datasets. To use such an open behaviour, select two or more datasets of the same type in the dataset list by holding the Ctrl key and clicking the datasets you would like to compare. Then, click “Comparison” in the ribbon or right-click one of the selected datasets and select “Compare”. If there are multiple comparison views available, a context menu will allow you to choose the right one.
